Working with Time Series
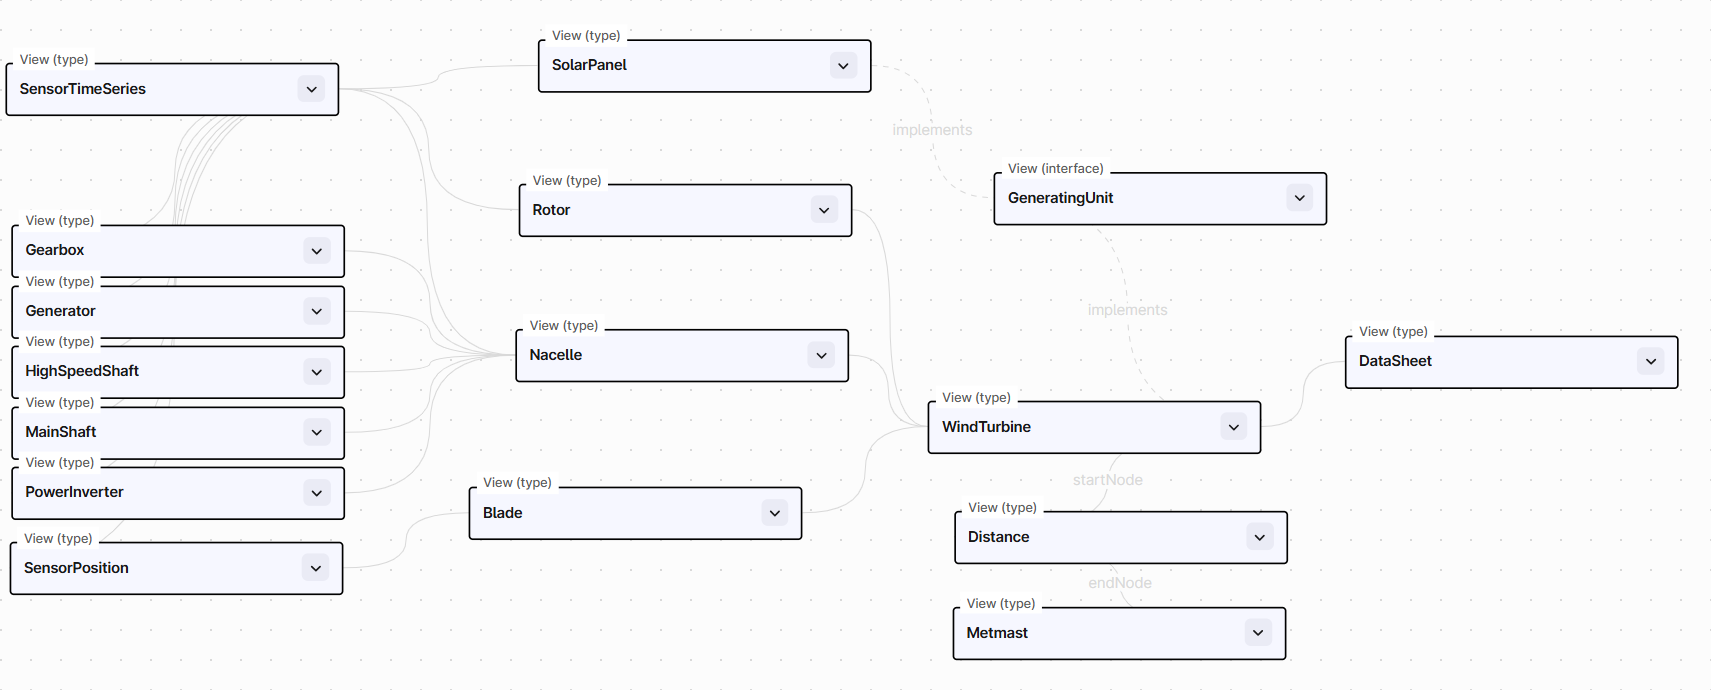
To demonstrate working with time series, we have a data model with one view matching exactly the container, named ScenarioInstance
. The view is illustrated below with a few of the rows with data and listing data types in parenthesis of the column headers.
aggregation (String) | country (String) | instance (Timestamp) | market (String) | priceArea (String) | priceForecast (TimeSeries) | scenario (String) | start (Timestamp) | |
---|---|---|---|---|---|---|---|---|
0 | Norway | 2023-09-06 22:00:00+00:00 | Day-ahead | NO1 | scenario_instance:NO1:Day-ahead:2023-09-21:2023-09-07:scenario1 | scenario1 | 2023-09-20 22:00:00+00:00 | |
1 | Norway | 2023-09-06 22:00:00+00:00 | Day-ahead | NO1 | scenario_instance:NO1:Day-ahead:2023-09-21:2023-09-07:scenario2 | scenario2 | 2023-09-20 22:00:00+00:00 | |
2 | Norway | 2023-09-06 22:00:00+00:00 | Day-ahead | NO1 | scenario_instance:NO1:Day-ahead:2023-09-21:2023-09-07:scenario3 | scenario3 | 2023-09-20 22:00:00+00:00 | |
3 | mean | Norway | 2023-09-06 22:00:00+00:00 | NO1 | scenario_instance:NO1:Day-ahead:2023-09-21:2023-09-07:mean | 2023-09-20 22:00:00+00:00 | ||
4 | median | Norway | 2023-09-06 22:00:00+00:00 | NO1 | scenario_instance:NO1:Day-ahead:2023-09-21:2023-09-07:median | 2023-09-20 22:00:00+00:00 | ||
5 | 10.0% | Norway | 2023-09-06 22:00:00+00:00 | NO1 | scenario_instance:NO1:Day-ahead:2023-09-21:2023-09-07:10.0% | 2023-09-20 22:00:00+00:00 | ||
6 | 90.0% | Norway | 2023-09-06 22:00:00+00:00 | NO1 | scenario_instance:NO1:Day-ahead:2023-09-21:2023-09-07:90.0% | 2023-09-20 22:00:00+00:00 | ||
7 | Norway | 2023-09-07 22:00:00+00:00 | Day-ahead | NO1 | scenario_instance:NO1:Day-ahead:2023-09-21:2023-09-08:scenario1 | scenario1 | 2023-09-20 22:00:00+00:00 | |
8 | Norway | 2023-09-07 22:00:00+00:00 | Day-ahead | NO1 | scenario_instance:NO1:Day-ahead:2023-09-21:2023-09-08:scenario2 | scenario2 | 2023-09-20 22:00:00+00:00 | |
9 | Norway | 2023-09-07 22:00:00+00:00 | Day-ahead | NO1 | scenario_instance:NO1:Day-ahead:2023-09-21:2023-09-08:scenario3 | scenario3 | 2023-09-20 22:00:00+00:00 | |
... | ... | ... | ... | ... | ... | ... | ... | ... |
The same data model shown in Cognite Data Fusion interface:
We note that we have one TimeSeries
field priceForecast
along with 7 different fields of type String
or Timestamp
. The goal of this exmaple is to show how we can filter on the 7 different Sting
and Timestamp
types to select
which priceForecast
timeseries to retrive, in addition, to aggregation on the time series datapoints directly.
First, we have to generate an SDK for the ScenarioInstance
model. The call below shows a truncated version of the call used to generate the SDK.
pygen generate --client-name ScenarioInstanceClient --to-level-package scenario_instance.client
Note that you can use any of the methods for generating the SDK as described in see the QuickStart guides.
Second, we have setup a config.toml
in the current working directory with credentials to connect to Cognite Data Fusion
from scenario_instance.client import ScenarioInstanceClient
scenario = ScenarioInstanceClient.from_toml("config.toml")
Listing timeseries
We can list a filtered version of the timeseries using the .price_forecast.list()
method
from IPython.display import display
timeseries = scenario.scenario_instance.price_forecast.list(country="Norway", market="aFRR", limit=10)
timeseries
id | external_id | name | is_string | metadata | is_step | security_categories | data_set_id | created_time | last_updated_time | |
---|---|---|---|---|---|---|---|---|---|---|
0 | 4832145216682444 | scenario_instance:NO1:aFRR:2023-09-21:2023-09-... | Start=2023-09-21, Scenario=scenario1 Instance=... | False | {'external_id': 'scenario_instance:NO1:aFRR:20... | False | [] | 6349832762881935 | 2023-09-23 07:51:53.162 | 2023-09-23 07:51:53.162 |
1 | 2842984978245990 | scenario_instance:NO1:aFRR:2023-09-21:2023-09-... | Start=2023-09-21, Scenario=scenario2 Instance=... | False | {'external_id': 'scenario_instance:NO1:aFRR:20... | False | [] | 6349832762881935 | 2023-09-23 07:51:53.162 | 2023-09-23 07:51:53.162 |
2 | 4407905781277132 | scenario_instance:NO1:aFRR:2023-09-21:2023-09-... | Start=2023-09-21, Scenario=scenario3 Instance=... | False | {'external_id': 'scenario_instance:NO1:aFRR:20... | False | [] | 6349832762881935 | 2023-09-23 07:51:53.162 | 2023-09-23 07:51:53.162 |
3 | 569669168667745 | scenario_instance:NO1:aFRR:2023-09-21:2023-09-... | Start=2023-09-21, Scenario=scenario1 Instance=... | False | {'external_id': 'scenario_instance:NO1:aFRR:20... | False | [] | 6349832762881935 | 2023-09-23 07:51:53.162 | 2023-09-23 07:51:53.162 |
4 | 6038443942604884 | scenario_instance:NO1:aFRR:2023-09-21:2023-09-... | Start=2023-09-21, Scenario=scenario2 Instance=... | False | {'external_id': 'scenario_instance:NO1:aFRR:20... | False | [] | 6349832762881935 | 2023-09-23 07:51:53.162 | 2023-09-23 07:51:53.162 |
5 | 1394105247980751 | scenario_instance:NO1:aFRR:2023-09-21:2023-09-... | Start=2023-09-21, Scenario=scenario3 Instance=... | False | {'external_id': 'scenario_instance:NO1:aFRR:20... | False | [] | 6349832762881935 | 2023-09-23 07:51:53.162 | 2023-09-23 07:51:53.162 |
6 | 2454885165052490 | scenario_instance:NO1:aFRR:2023-09-21:2023-09-... | Start=2023-09-21, Scenario=scenario1 Instance=... | False | {'external_id': 'scenario_instance:NO1:aFRR:20... | False | [] | 6349832762881935 | 2023-09-23 07:51:53.162 | 2023-09-23 07:51:53.162 |
7 | 3684494002508782 | scenario_instance:NO1:aFRR:2023-09-21:2023-09-... | Start=2023-09-21, Scenario=scenario2 Instance=... | False | {'external_id': 'scenario_instance:NO1:aFRR:20... | False | [] | 6349832762881935 | 2023-09-23 07:51:53.162 | 2023-09-23 07:51:53.162 |
8 | 6681002994595602 | scenario_instance:NO1:aFRR:2023-09-21:2023-09-... | Start=2023-09-21, Scenario=scenario3 Instance=... | False | {'external_id': 'scenario_instance:NO1:aFRR:20... | False | [] | 6349832762881935 | 2023-09-23 07:51:53.162 | 2023-09-23 07:51:53.162 |
9 | 2037335729671653 | scenario_instance:NO1:aFRR:2023-09-21:2023-09-... | Start=2023-09-21, Scenario=scenario1 Instance=... | False | {'external_id': 'scenario_instance:NO1:aFRR:20... | False | [] | 6349832762881935 | 2023-09-23 07:51:53.162 | 2023-09-23 07:51:53.162 |
display(type(timeseries))
cognite.client.data_classes.time_series.TimeSeriesList
The return type of the .list()
is the a TimeSeriesList
which comes from the cognite-sdk
. This should be very familiar to anyone that has worked with cognite-sdk
.
Retriving Data Points
datapoints = scenario.scenario_instance.price_forecast(limit=3).retrieve(limit=10)
display(type(datapoints))
cognite.client.data_classes.datapoints.DatapointsList
datapoints
scenario_instance:NO1:Day-ahead:2023-09-21:2023-09-07:scenario1 | scenario_instance:NO1:Day-ahead:2023-09-21:2023-09-07:scenario2 | scenario_instance:NO1:Day-ahead:2023-09-21:2023-09-07:scenario3 | |
---|---|---|---|
2023-09-20 22:00:00 | 42.543824 | 27.207645 | 31.197757 |
2023-09-20 23:00:00 | 55.624989 | 96.500942 | 0.050365 |
2023-09-21 00:00:00 | 15.630149 | 39.455775 | 91.376742 |
2023-09-21 01:00:00 | 71.333070 | 31.782909 | 17.870387 |
2023-09-21 02:00:00 | 99.345092 | 36.165970 | 62.339971 |
2023-09-21 03:00:00 | 25.707452 | 15.599195 | 43.319833 |
2023-09-21 04:00:00 | 4.652626 | 73.245242 | 98.953178 |
2023-09-21 05:00:00 | 11.471650 | 29.088107 | 57.111580 |
2023-09-21 06:00:00 | 92.869446 | 75.556476 | 97.155684 |
2023-09-21 07:00:00 | 81.005675 | 69.170392 | 30.144841 |
Call Expaination
The structure of the calls scenario.scenario_instance.price_forecast(limit=3).retrieve(limit=10)
requires some extra expaination.
- The first call
price_forecast(limit=3)
determines how many time series to retrieve. This also support filtering on the timeseries you want. - The second call
retrieve(limit=10)
determines how many datapoints for each of those time series to retrieve. This supportsaggregation
on the datapoints.
For the user used with working with time series using the regulare cognite-sdk
(pip install cognite-sdk
) the second call should feel familiar. This is the same call the
time_series.data.retrieve(...)
with the expection of the parameters external_id
and id
.
from cognite.client import CogniteClient
client = CogniteClient
client.time_series.data.retrieve(...)
The retrieve()
method is not the only one available in addition, we have
scenario.scenario_instance.price_forecast(...).retrieve_arrays(...)
scenario.scenario_instance.price_forecast(...).retrieve_dataframe(...)
scenario.scenario_instance.price_forecast(...).retrieve_dataframe_in_tz(... )
scenario.scenario_instance.price_forecast(...).retrieve_latest(... )
Retrieving numpy
Arrays
arrays = scenario.scenario_instance.price_forecast(price_area=["NO3", "NO4"], limit=5).retrieve_arrays(aggregates="average", granularity="1d")
display(type(arrays))
cognite.client.data_classes.datapoints.DatapointsArrayList
arrays
scenario_instance:NO3:Day-ahead:2023-09-21:2023-09-07:scenario1|average | scenario_instance:NO3:Day-ahead:2023-09-21:2023-09-07:scenario2|average | scenario_instance:NO3:Day-ahead:2023-09-21:2023-09-07:scenario3|average | scenario_instance:NO3:Day-ahead:2023-09-21:2023-09-07:mean|average | scenario_instance:NO3:Day-ahead:2023-09-21:2023-09-07:median|average | |
---|---|---|---|---|---|
2023-09-20 | 75.385699 | 28.039528 | 74.362605 | 59.262611 | 61.950719 |
2023-09-21 | 45.627034 | 62.004966 | 44.981899 | 50.871300 | 52.136876 |
2023-09-22 | 50.325700 | 51.383441 | 52.060273 | 51.256471 | 50.053884 |
2023-09-23 | 46.347317 | 44.527587 | 55.743623 | 48.872842 | 44.530589 |
2023-09-24 | 53.093665 | 51.865321 | 49.623680 | 51.527555 | 52.892066 |
2023-09-25 | 46.794225 | 46.544662 | 49.583434 | 47.640774 | 44.427251 |
2023-09-26 | 41.335499 | 50.434179 | 52.398554 | 48.056077 | 45.539188 |
2023-09-27 | 40.105992 | 41.702423 | 57.219620 | 46.342678 | 48.503055 |
2023-09-28 | 54.425058 | 49.379999 | 43.135727 | 48.980261 | 47.193315 |
2023-09-29 | 43.364598 | 47.735155 | 55.399180 | 48.832978 | 51.463123 |
2023-09-30 | 58.271654 | 54.584197 | 46.510907 | 53.122253 | 55.288605 |
2023-10-01 | 48.950642 | 41.660647 | 61.739592 | 50.783627 | 53.200751 |
2023-10-02 | 52.773755 | 54.682418 | 48.712920 | 52.056365 | 53.118099 |
2023-10-03 | 53.093360 | 51.666179 | 60.389143 | 55.049561 | 58.216943 |
2023-10-04 | 32.827897 | 50.022764 | 46.680712 | 43.177125 | 41.994107 |
Retrieving pandas
DataFrame
df = scenario.scenario_instance.price_forecast(market="Day-ahead", limit=2).retrieve_dataframe(aggregates=["min", "max"], granularity="24h")
df
scenario_instance:NO1:Day-ahead:2023-09-21:2023-09-07:scenario1|max | scenario_instance:NO1:Day-ahead:2023-09-21:2023-09-07:scenario1|min | scenario_instance:NO1:Day-ahead:2023-09-21:2023-09-07:scenario2|max | scenario_instance:NO1:Day-ahead:2023-09-21:2023-09-07:scenario2|min | |
---|---|---|---|---|
2023-09-20 | 55.624989 | 42.543824 | 96.500942 | 27.207645 |
2023-09-21 | 99.345092 | 4.652626 | 89.441207 | 4.426355 |
2023-09-22 | 99.415418 | 2.037122 | 97.656625 | 2.901820 |
2023-09-23 | 93.461132 | 1.608159 | 97.496490 | 4.474315 |
2023-09-24 | 94.171674 | 1.186893 | 98.868153 | 5.995688 |
2023-09-25 | 99.997854 | 0.357046 | 94.343803 | 1.731561 |
2023-09-26 | 98.949963 | 3.199264 | 99.479757 | 1.652422 |
2023-09-27 | 98.304577 | 7.755338 | 85.796875 | 3.163772 |
2023-09-28 | 94.585949 | 8.642713 | 93.516244 | 10.008496 |
2023-09-29 | 96.184824 | 4.643276 | 82.614607 | 0.014620 |
2023-09-30 | 93.909833 | 7.936276 | 97.094662 | 0.360405 |
2023-10-01 | 99.270640 | 10.523940 | 89.439786 | 2.126645 |
2023-10-02 | 99.809033 | 2.655870 | 99.555128 | 0.742513 |
2023-10-03 | 99.342709 | 0.850527 | 97.436851 | 11.003308 |
2023-10-04 | 98.948935 | 5.892284 | 98.312417 | 5.110011 |
When retrieving a pandas
DataFrame, the generated SDK supports renaming the column names based on any of the other fields in the view.
In the call beolw, we filter on all the other properties except priceArea
and use priceArea
as the name of the columns instead of the externaId
of the time series
from datetime import datetime
df = scenario.scenario_instance.price_forecast(
min_instance=datetime(2023, 9, 10),
max_instance=datetime(2023, 9, 11),
min_start=datetime(2023, 9, 23),
max_start=datetime(2023, 9, 24),
market="Day-ahead",
country="Norway",
scenario="scenario1", limit=10).retrieve_dataframe(aggregates="average", granularity="1d", column_names="priceArea")
df
NO1|average | NO2|average | NO3|average | NO4|average | NO5|average | |
---|---|---|---|---|---|
2023-09-23 | 74.319249 | 38.464454 | 38.739823 | 57.307569 | 87.068250 |
2023-09-24 | 39.536642 | 53.456107 | 55.716532 | 55.300441 | 53.322534 |
Retrieving pandas
DataFrame in Time Zone
from datetime import datetime
from zoneinfo import ZoneInfo
tz = ZoneInfo("Europe/Oslo")
start = datetime(2023, 9, 21, tzinfo=tz)
end = datetime(2023, 9, 28, tzinfo=tz)
df = scenario.scenario_instance.price_forecast(market="aFRR", price_area="NO1", limit=5).retrieve_dataframe_in_tz(start, end, column_names=["country", "start", "instance"])
df
Norway-2023-09-20T22:00:00+00:00-2023-09-06T22:00:00+00:00 | Norway-2023-09-20T22:00:00+00:00-2023-09-06T22:00:00+00:00 | Norway-2023-09-20T22:00:00+00:00-2023-09-06T22:00:00+00:00 | Norway-2023-09-20T22:00:00+00:00-2023-09-07T22:00:00+00:00 | Norway-2023-09-20T22:00:00+00:00-2023-09-07T22:00:00+00:00 | |
---|---|---|---|---|---|
2023-09-21 00:00:00+02:00 | 96.220590 | 4.233595 | 90.719355 | 35.895511 | 67.443442 |
2023-09-21 01:00:00+02:00 | 37.061390 | 36.993029 | 79.280685 | 19.698027 | 18.294888 |
2023-09-21 02:00:00+02:00 | 83.328886 | 47.436170 | 62.418286 | 60.251462 | 4.031537 |
2023-09-21 03:00:00+02:00 | 49.851274 | 71.629861 | 16.740850 | 12.069461 | 15.655898 |
2023-09-21 04:00:00+02:00 | 30.740467 | 8.858023 | 63.957445 | 64.822675 | 74.852698 |
... | ... | ... | ... | ... | ... |
2023-09-27 19:00:00+02:00 | 68.540734 | 6.767874 | 60.454826 | 44.445546 | 48.901137 |
2023-09-27 20:00:00+02:00 | 1.515058 | 71.533502 | 89.763187 | 63.990720 | 11.769747 |
2023-09-27 21:00:00+02:00 | 60.200468 | 35.729739 | 90.471403 | 30.544108 | 39.151853 |
2023-09-27 22:00:00+02:00 | 47.006708 | 82.180196 | 91.541581 | 63.358762 | 14.273487 |
2023-09-27 23:00:00+02:00 | 0.905541 | 26.767410 | 23.773278 | 78.147826 | 28.917409 |
168 rows × 5 columns
Retriving Latest
datapoints = scenario.scenario_instance.price_forecast(market="aFRR", price_area="NO1", limit=5).retrieve_latest()
datapoints
scenario_instance:NO1:aFRR:2023-09-21:2023-09-07:scenario1 | scenario_instance:NO1:aFRR:2023-09-21:2023-09-07:scenario2 | scenario_instance:NO1:aFRR:2023-09-21:2023-09-07:scenario3 | scenario_instance:NO1:aFRR:2023-09-21:2023-09-08:scenario1 | scenario_instance:NO1:aFRR:2023-09-21:2023-09-08:scenario2 | |
---|---|---|---|---|---|
2023-09-24 11:00:00 | 85.714107 | 6.104835 | 22.758304 | 17.549131 | 57.479033 |
display(type(datapoints))
cognite.client.data_classes.datapoints.DatapointsList
Plotting Timeseries
pandas
has built in plotting and thus just chose a retrive methods that returns a pandas
DataFrame and call .plot()
on it.
tz = ZoneInfo("Europe/Oslo")
start = datetime(2023, 9, 21, tzinfo=tz)
end = datetime(2023, 9, 28, tzinfo=tz)
df = scenario.scenario_instance.price_forecast(
min_instance=datetime(2023, 9, 10),
max_instance=datetime(2023, 9, 11),
min_start=datetime(2023, 9, 23),
max_start=datetime(2023, 9, 24),
market="Day-ahead",
country="Norway",
scenario="scenario1", limit=10).retrieve_dataframe_in_tz(start, end, aggregates="average", granularity="6h", column_names="priceArea")
df.plot(figsize=(15, 7));